How to Add a Real-Time Performance Monitor to Your Shopify Store in ~2 min
Ever wonder what's actually slowing down your Shopify store? Sure, you can run Google PageSpeed tests, but those give you a snapshot - not what's happening in real-time as customers browse your site.
We built a simple performance monitor that sits on your store and shows you exactly what's happening under the hood. Takes 2 minutes to install, runs continuously, and gives you the data you need to fix the obvious bottlenecks (just don’t deploy to live!).
What This Monitor Shows You
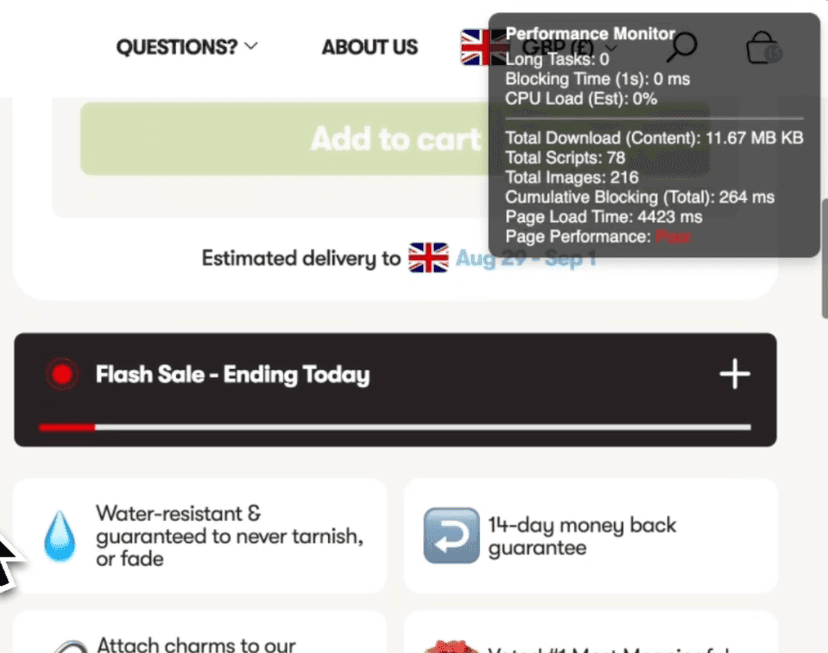
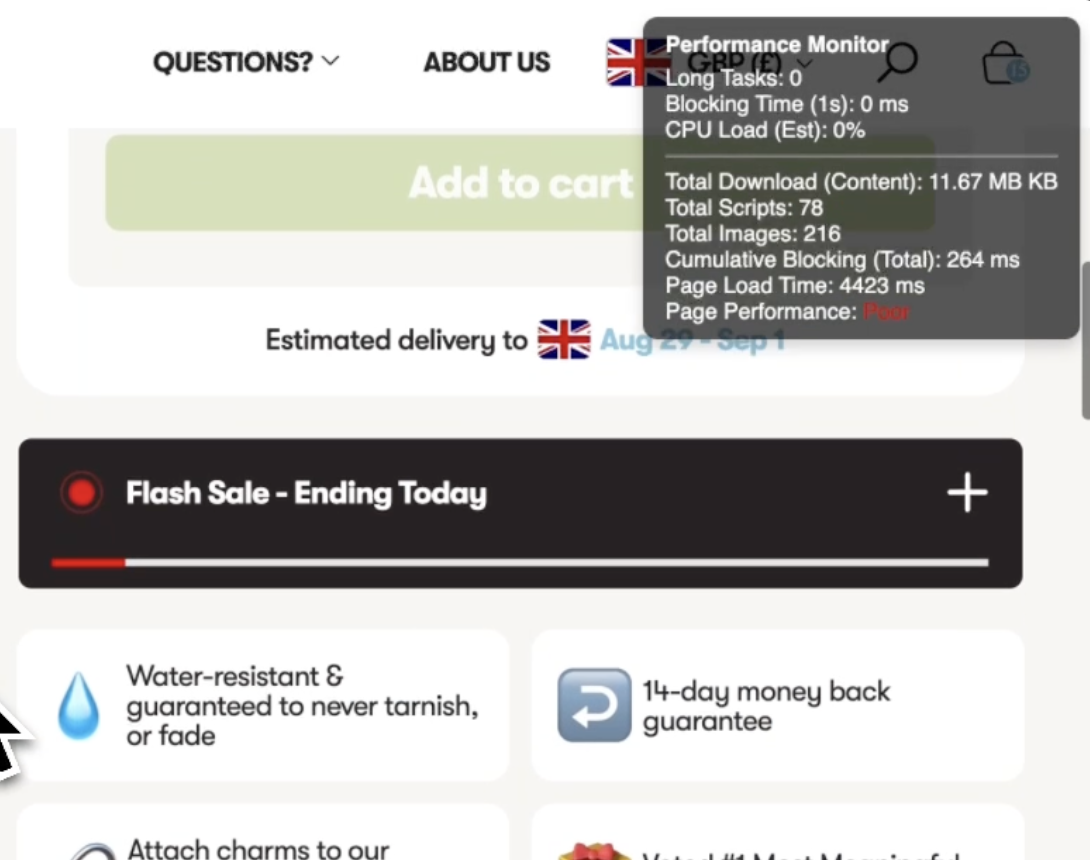
The tool creates a small overlay in the top-right corner of your store that displays:
Real-time metrics (updates every second):
- Long Tasks: How many processes are blocking your UI
- Blocking Time: How long users wait for your page to respond
- CPU Load: How hard your site is working the browser
Static metrics (total page load):
- Total Download Size: How much data customers download
- Total Scripts: Number of JavaScript files loading
- Total Images: How many images are being fetched
- Page Load Time: Complete load time from start to finish
- Performance Rating: Good/Average/Poor based on load time
Why These Numbers Matter
Here's what to look for and why it matters:
🔴 Red Flags:
- 150+ images: You're probably loading carousel images that aren't visible
- 40+ scripts: Apps are adding too many JavaScript files
- 1000ms+ blocking time: Something is freezing your page for full seconds
- Poor rating (4+ seconds): You're bleeding mobile conversions
✅ Good Numbers:
- <50 images: Reasonable for most PDPs
- <15 scripts: Clean, optimized site
- <500ms blocking: Smooth user experience
- Good rating (<2.5 seconds): Fast enough for mobile
How to Install on Shopify
🚨 Step 0: CREATE A DRAFT THEME - I cannot stress this enough. Make a duplicate theme and use this for testing - do not edit your main theme.
Step 1: Access Your Theme Code
- Go to Online Store → Themes
- Click the three dots next to your live theme
- Select "Edit code"
Step 2: Add the Monitor to theme.liquid
- Find
theme.liquidin the Layout folder - Scroll to the bottom, just before the closing
</body>tag - Add this code:
<div id="performance-monitor" style="
			position: fixed;
			top: 10px;
			right: 10px;
			background-color: rgba(0, 0, 0, 0.7);
			color: white;
			padding: 8px 12px;
			border-radius: 8px;
			font-family: 'Inter', sans-serif;
			font-size: 12px;
			z-index: 9999;
			min-width: 200px; /* Increased width to accommodate new metrics */
			text-align: left;
			box-shadow: 0 4px 8px rgba(0, 0, 0, 0.2);
			transition: background-color 0.3s ease;
		">
			<div style="font-weight: bold; margin-bottom: 4px;">Performance Monitor</div>
			<div>Long Tasks: <span id="long-tasks-count">0</span></div>
			<div>Blocking Time (1s): <span id="blocking-time">0</span> ms</div>
			<div>CPU Load (Est): <span id="cpu-load-est">0</span>%</div>
			<hr style="border-color: rgba(255, 255, 255, 0.3); margin: 6px 0;">
			<div>Total Download (Content): <span id="total-download-size">0</span> KB</div>
			<div>Total Scripts: <span id="total-scripts-count">0</span></div>
			<div>Total Images: <span id="total-images-downloaded">0</span></div>
			<div>Cumulative Blocking (Total): <span id="cumulative-blocking-time">0</span> ms</div>
			<div>Page Load Time: <span id="page-load-time">0</span> ms</div>
			<div>Page Performance: <span id="performance-rating">N/A</span></div>
		</div>

		<script>
			// Immediately Invoked Function Expression (IIFE) to prevent global scope pollution.
			(function() {
				// ALL variables for performance metrics, declared at the very top of the IIFE
				// to ensure they are defined and accessible to all closures within this scope.
				let longTaskEntries = [];
				let initialPageLoadTimeCalculated = false;
				let totalDecodedBodyBytes = 0; // Total actual content size after decoding (for "Total Download")
				let totalScriptsCount = 0; // New: Count of script files
				let totalImagesDownloaded = 0; // Count of image files
				let cumulativeBlockingTime = 0;
				let initialPageLoadTime = 0; // Will store loadEventEnd or fallback time

				// Retained for internal calculation if needed, but not displayed directly as per new request
				let totalTransferredBytes = 0; // Bytes transferred over network (0 if from cache)
				let totalScriptDownloadMs = 0; // Total duration for script downloads

				const MONITOR_WINDOW_MS = 1000; // Monitor activity over the last 1 second
				const FALLBACK_LOAD_TIMEOUT_MS = 15000; // 15 seconds timeout for page load (Updated as requested)
				const NETWORK_IDLE_THRESHOLD_MS = 5000; // 5 seconds of network idle for fallback (Updated as requested)
				let lastResourceFetchTime = performance.now(); // Track last resource fetch for network idle detection
				let pageLoadFallbackTimer = null; // Timer for the 25s fallback

				// Object to hold references to DOM elements, populated once DOMContentLoaded fires
				const domElements = {};

				// Check if PerformanceObserver is supported by the browser.
				if (!window.PerformanceObserver) {
					console.warn('PerformanceObserver API not supported by this browser.');
					return;
				}

				const supportedEntryTypes = PerformanceObserver.supportedEntryTypes || [];

				// Function to update the static page load metrics
				function updateStaticPageLoadMetrics() {
					if (!domElements.totalDownloadSizeSpan) {
						return; // Exit if DOM elements haven't been populated yet
					}

					// --- Total Download (Content) in MB/KB ---
					let totalDownloadText;
					if (totalDecodedBodyBytes >= 1024 * 1024) { // 1MB
						totalDownloadText = (totalDecodedBodyBytes / (1024 * 1024)).toFixed(2) + ' MB';
					} else {
						totalDownloadText = (totalDecodedBodyBytes / 1024).toFixed(2) + ' KB';
					}
					if (domElements.totalDownloadSizeSpan) domElements.totalDownloadSizeSpan.textContent = totalDownloadText;

					if (domElements.totalScriptsCountSpan) domElements.totalScriptsCountSpan.textContent = totalScriptsCount;
					if (domElements.totalImagesDownloadedSpan) domElements.totalImagesDownloadedSpan.textContent = totalImagesDownloaded;
					if (domElements.cumulativeBlockingTimeSpan) domElements.cumulativeBlockingTimeSpan.textContent = cumulativeBlockingTime.toFixed(0);

					// Only update initial page load time and rating if it has been calculated
					if (initialPageLoadTimeCalculated) {
						if (domElements.pageLoadTimeSpan) domElements.pageLoadTimeSpan.textContent = initialPageLoadTime.toFixed(0);

						// Determine page performance rating based on initial page load time
						let rating = 'N/A';
						if (initialPageLoadTime < 2500) { // Less than 2.5 seconds
							rating = 'Good';
							if (domElements.performanceRatingSpan) domElements.performanceRatingSpan.style.color = '#0f0'; // Green
						} else if (initialPageLoadTime >= 2500 && initialPageLoadTime < 4000) { // Between 2.5 and 4 seconds
							rating = 'Average';
							if (domElements.performanceRatingSpan) domElements.performanceRatingSpan.style.color = '#ff0'; // Yellow
						} else { // Greater than 4 seconds
							rating = 'Poor';
							if (domElements.performanceRatingSpan) domElements.performanceRatingSpan.style.color = '#f00'; // Red
						}
						if (domElements.performanceRatingSpan) domElements.performanceRatingSpan.textContent = rating;
					} else {
						if (domElements.pageLoadTimeSpan) domElements.pageLoadTimeSpan.textContent = 'Calculating...';
						if (domElements.performanceRatingSpan) {
							domElements.performanceRatingSpan.textContent = 'N/A';
							domElements.performanceRatingSpan.style.color = 'white';
						}
					}
				}

				// Function to handle the page load fallback
				function triggerPageLoadFallback() {
					if (!initialPageLoadTimeCalculated) {
						// If loadEventEnd hasn't fired, use current time as fallback load time
						initialPageLoadTime = performance.now();
						initialPageLoadTimeCalculated = true;
						console.warn('Page load time estimated via fallback (timeout or network idle).'); // Retained for important fallback info
					}
					updateStaticPageLoadMetrics(); // Ensure display is updated right after fallback
				}

				// Performance Observer for 'longtask' entries (real-time CPU load proxy)
				const longTaskObserver = new PerformanceObserver((list) => {
					list.getEntries().forEach(entry => {
						longTaskEntries.push(entry);
						cumulativeBlockingTime += Math.max(0, entry.duration - 50);
					});
				});
				longTaskObserver.observe({ type: 'longtask', buffered: true });

				// Check if 'resource' and 'navigation' entry types are supported
				const supportsResource = supportedEntryTypes.includes('resource');
				const supportsNavigation = supportedEntryTypes.includes('navigation');

				if (!supportsResource && !supportsNavigation) {
					console.warn("Browser does not support 'resource' or 'navigation' PerformanceObserver entry types. Total Download, Total Scripts, and Total Images will not be available."); // Retained for important API support info
				} else {
					// Performance Observer for 'resource' entries
					if (supportsResource) {
						try {
							const resourceObserver = new PerformanceObserver((list) => {
								list.getEntries().forEach(entry => {
									if (entry.entryType === 'resource') {
										// Accumulate decoded body size for "Total Download"
										totalDecodedBodyBytes += entry.decodedBodySize || 0;
										// Accumulate transferred size for "Total Transferred (Network)" (internal, not displayed)
										totalTransferredBytes += entry.transferSize || 0;

										// --- SCRIPT DETECTION USING initiatorType ---
										if (entry.initiatorType === 'script') {
											totalScriptsCount++; // Increment script count
											totalScriptDownloadMs += entry.duration || 0; // Keep track of download time internally
										}

										// --- IMAGE DETECTION USING initiatorType ---
										const imageInitiators = ['img', 'image', 'css', 'link', 'fetch', 'xmlhttprequest'];
										if (imageInitiators.includes(entry.initiatorType)) {
											totalImagesDownloaded++;
										}

										// Update last resource fetch time for network idle detection
										lastResourceFetchTime = performance.now();
									}
								});
							});
							resourceObserver.observe({ type: 'resource', buffered: true });
						} catch (e) {
							console.error("Error observing 'resource' entries:", e); // Retained for error debugging
						}
					}

					// Performance Observer for 'navigation' entries
					if (supportsNavigation) {
						try {
							const navigationObserver = new PerformanceObserver((list) => {
								list.getEntries().forEach(entry => {
									if (entry.entryType === 'navigation' && !initialPageLoadTimeCalculated) {
										// --- Page Load Time Logic Refinement ---
										// Only set initialPageLoadTime and flag if loadEventEnd is valid (greater than 0)
										if (entry.loadEventEnd > 0) {
											initialPageLoadTime = entry.loadEventEnd;
											initialPageLoadTimeCalculated = true;
											if (pageLoadFallbackTimer) {
												clearTimeout(pageLoadFallbackTimer);
											}
											// Crucial: Call updateStaticPageLoadMetrics right after initialPageLoadTime is set
											updateStaticPageLoadMetrics();
										} else {
											console.warn('Navigation entry received, but loadEventEnd is 0. Relying on fallback.'); // Retained for important fallback info
										}
									}
								});
							});
							navigationObserver.observe({ type: 'navigation', buffered: true });
						} catch (e) {
							console.error("Error observing 'navigation' entries:", e); // Retained for error debugging
						}
					}

					// Set a timeout for the page load fallback ONLY if resource/navigation are supported
					if (supportsResource || supportsNavigation) {
						pageLoadFallbackTimer = setTimeout(triggerPageLoadFallback, FALLBACK_LOAD_TIMEOUT_MS);
					}
				}

				// === DOM-dependent logic starts here, wrapped in DOMContentLoaded ===
				document.addEventListener('DOMContentLoaded', () => {
					// Populate the domElements object with references once the DOM is ready
					domElements.monitorDiv = document.getElementById('performance-monitor');
					domElements.longTasksCountSpan = document.getElementById('long-tasks-count');
					domElements.blockingTimeSpan = document.getElementById('blocking-time');
					domElements.cumulativeBlockingTimeSpan = document.getElementById('cumulative-blocking-time');
					domElements.cpuLoadEstSpan = document.getElementById('cpu-load-est');
					domElements.totalDownloadSizeSpan = document.getElementById('total-download-size');
					domElements.totalScriptsCountSpan = document.getElementById('total-scripts-count');
					domElements.totalImagesDownloadedSpan = document.getElementById('total-images-downloaded');
					domElements.pageLoadTimeSpan = document.getElementById('page-load-time');
					domElements.performanceRatingSpan = document.getElementById('performance-rating');

					// Function to update the real-time performance display (Long Tasks, CPU Load)
					function updateRealtimePerformanceDisplay() {
						const now = performance.now();

						longTaskEntries = longTaskEntries.filter(entry => (now - entry.startTime) <= MONITOR_WINDOW_MS);

						let totalLongTasks = longTaskEntries.length;
						let totalBlockingTime = 0;
						let totalLongTaskDuration = 0;

						longTaskEntries.forEach(entry => {
							totalLongTaskDuration += entry.duration;
							totalBlockingTime += Math.max(0, entry.duration - 50);
						});

						const cpuLoadPercentage = Math.min(100, (totalLongTaskDuration / MONITOR_WINDOW_MS) * 100).toFixed(0);

						if (domElements.longTasksCountSpan) domElements.longTasksCountSpan.textContent = totalLongTasks;
						if (domElements.blockingTimeSpan) domElements.blockingTimeSpan.textContent = totalBlockingTime.toFixed(0);
						if (domElements.cumulativeBlockingTimeSpan) domElements.cumulativeBlockingTimeSpan.textContent = cumulativeBlockingTime.toFixed(0);
						if (domElements.cpuLoadEstSpan) domElements.cpuLoadEstSpan.textContent = cpuLoadPercentage;

						if (domElements.monitorDiv) {
							if (parseInt(cpuLoadPercentage) > 75) {
								domElements.monitorDiv.style.backgroundColor = 'rgba(255, 0, 0, 0.7)';
							} else if (parseInt(cpuLoadPercentage) > 40) {
								domElements.monitorDiv.style.backgroundColor = 'rgba(255, 165, 0, 0.7)';
							} else {
								domElements.monitorDiv.style.backgroundColor = 'rgba(0, 0, 0, 0.7)';
							}
						}

						// Only check for network idle fallback if resource/navigation are supported
						if ((supportsResource || supportsNavigation) && !initialPageLoadTimeCalculated && (now - lastResourceFetchTime) > NETWORK_IDLE_THRESHOLD_MS) {
							triggerPageLoadFallback();
						}

						// Call updateStaticPageLoadMetrics here to ensure all totals are updated
						updateStaticPageLoadMetrics();

						requestAnimationFrame(updateRealtimePerformanceDisplay);
					}

					// Start the real-time monitoring loop
					requestAnimationFrame(updateRealtimePerformanceDisplay);

					// Initial update for static metrics, in case buffered entries are already there
					updateStaticPageLoadMetrics();
				}); // End of DOMContentLoaded listener

			})(); // End of IIFE
		</script>
Step 3: Save and Test
- Click "Save"
- Visit your store's frontend
- You should see the performance monitor appear in the top-right corner
How to Use the Data
Once installed, navigate around your store and watch the numbers:
On your homepage:
- Check total images - are you loading hero images for every product?
- Look at script count - each app typically adds 2-5 scripts
On product pages:
- Image count often spikes here due to product galleries
- Watch blocking time when switching between product variants
- Note if CPU load jumps when hovering over elements
During browsing:
- Pay attention to blocking time spikes - these cause lag
- High CPU load means customers experience stuttering
- Poor page load ratings mean you're losing mobile traffic
These are different to Google Page Speed scores
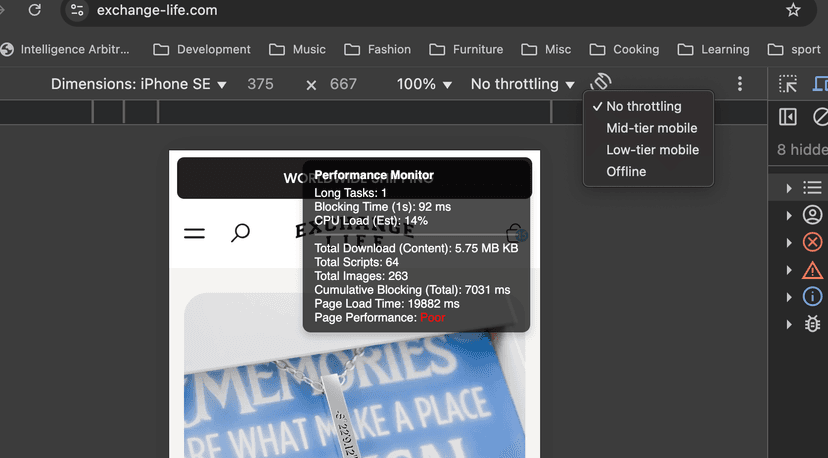
Google automatically throttles your traffic (makes it slow), but we can do a similar thing by accessing our dev tools.
- Right click
- Click Inspect
- At the top of your browser there should be a ‘No Throttling’ dropdown - here you can pick a slow device.
Run again and it should match more closely with page speed insights!
Common Issues You'll Discover
Too Many Hidden Images Loading Most Shopify stores load 60-80% more images than customers actually see. Product carousels, related product sections, and collection grids often preload everything.
App Script Bloat Each Shopify app typically adds 2-5 JavaScript files. With 10+ apps, you're easily hitting 40+ scripts, all competing for browser resources.
Render-Blocking Processes Some apps and widgets block your page from rendering while they load. These show up as high blocking times and poor user experience.
Oversized Resources Many stores download desktop-sized images on mobile, or load fonts and stylesheets that aren't needed immediately.
Quick Wins Based on Monitor Data
If you see 100+ images:
- Implement lazy loading for below-fold content
- Audit your product carousels and related product sections
- Check if your theme is preloading variant images
If you see 30+ scripts:
- Review your installed apps - delete unused ones
- Combine or defer non-critical scripts
- Move analytics and chat widgets to load after page render
If blocking time is consistently high:
- Check for heavy animations or transitions
- Look for apps that manipulate the DOM on page load
- Consider async loading for third-party widgets
When to Remove the Monitor
This monitor is meant for diagnostic purposes, not permanent installation. Once you've gathered data and made optimizations, remove the script from your theme.liquid file.
The overlay is only visible to you during testing - customers won't see it unless you specifically share the direct theme preview link.
Pro Tips
- Test on mobile: Performance issues are often worse on mobile devices
- Check different pages: Homepage, PDP, collection pages all have different performance profiles
- Monitor during traffic spikes: Performance can degrade under load
- Compare before/after: Take screenshots of metrics before and after optimizations
This monitor won't fix your performance issues, but it will show you exactly where to focus your efforts. Most Shopify stores have 1-2 obvious bottlenecks causing 80% of their speed problems - this tool helps you find them quickly.
Rather than guessing what's slowing you down, you'll have real data on what customers actually experience when browsing your store.