3 Shopify Reports That Expose Every Performance Issue on Your Site (Not Available From the Main Reports)
The head of CX at a 9-figure DTC brand was confident their site performance was fine.
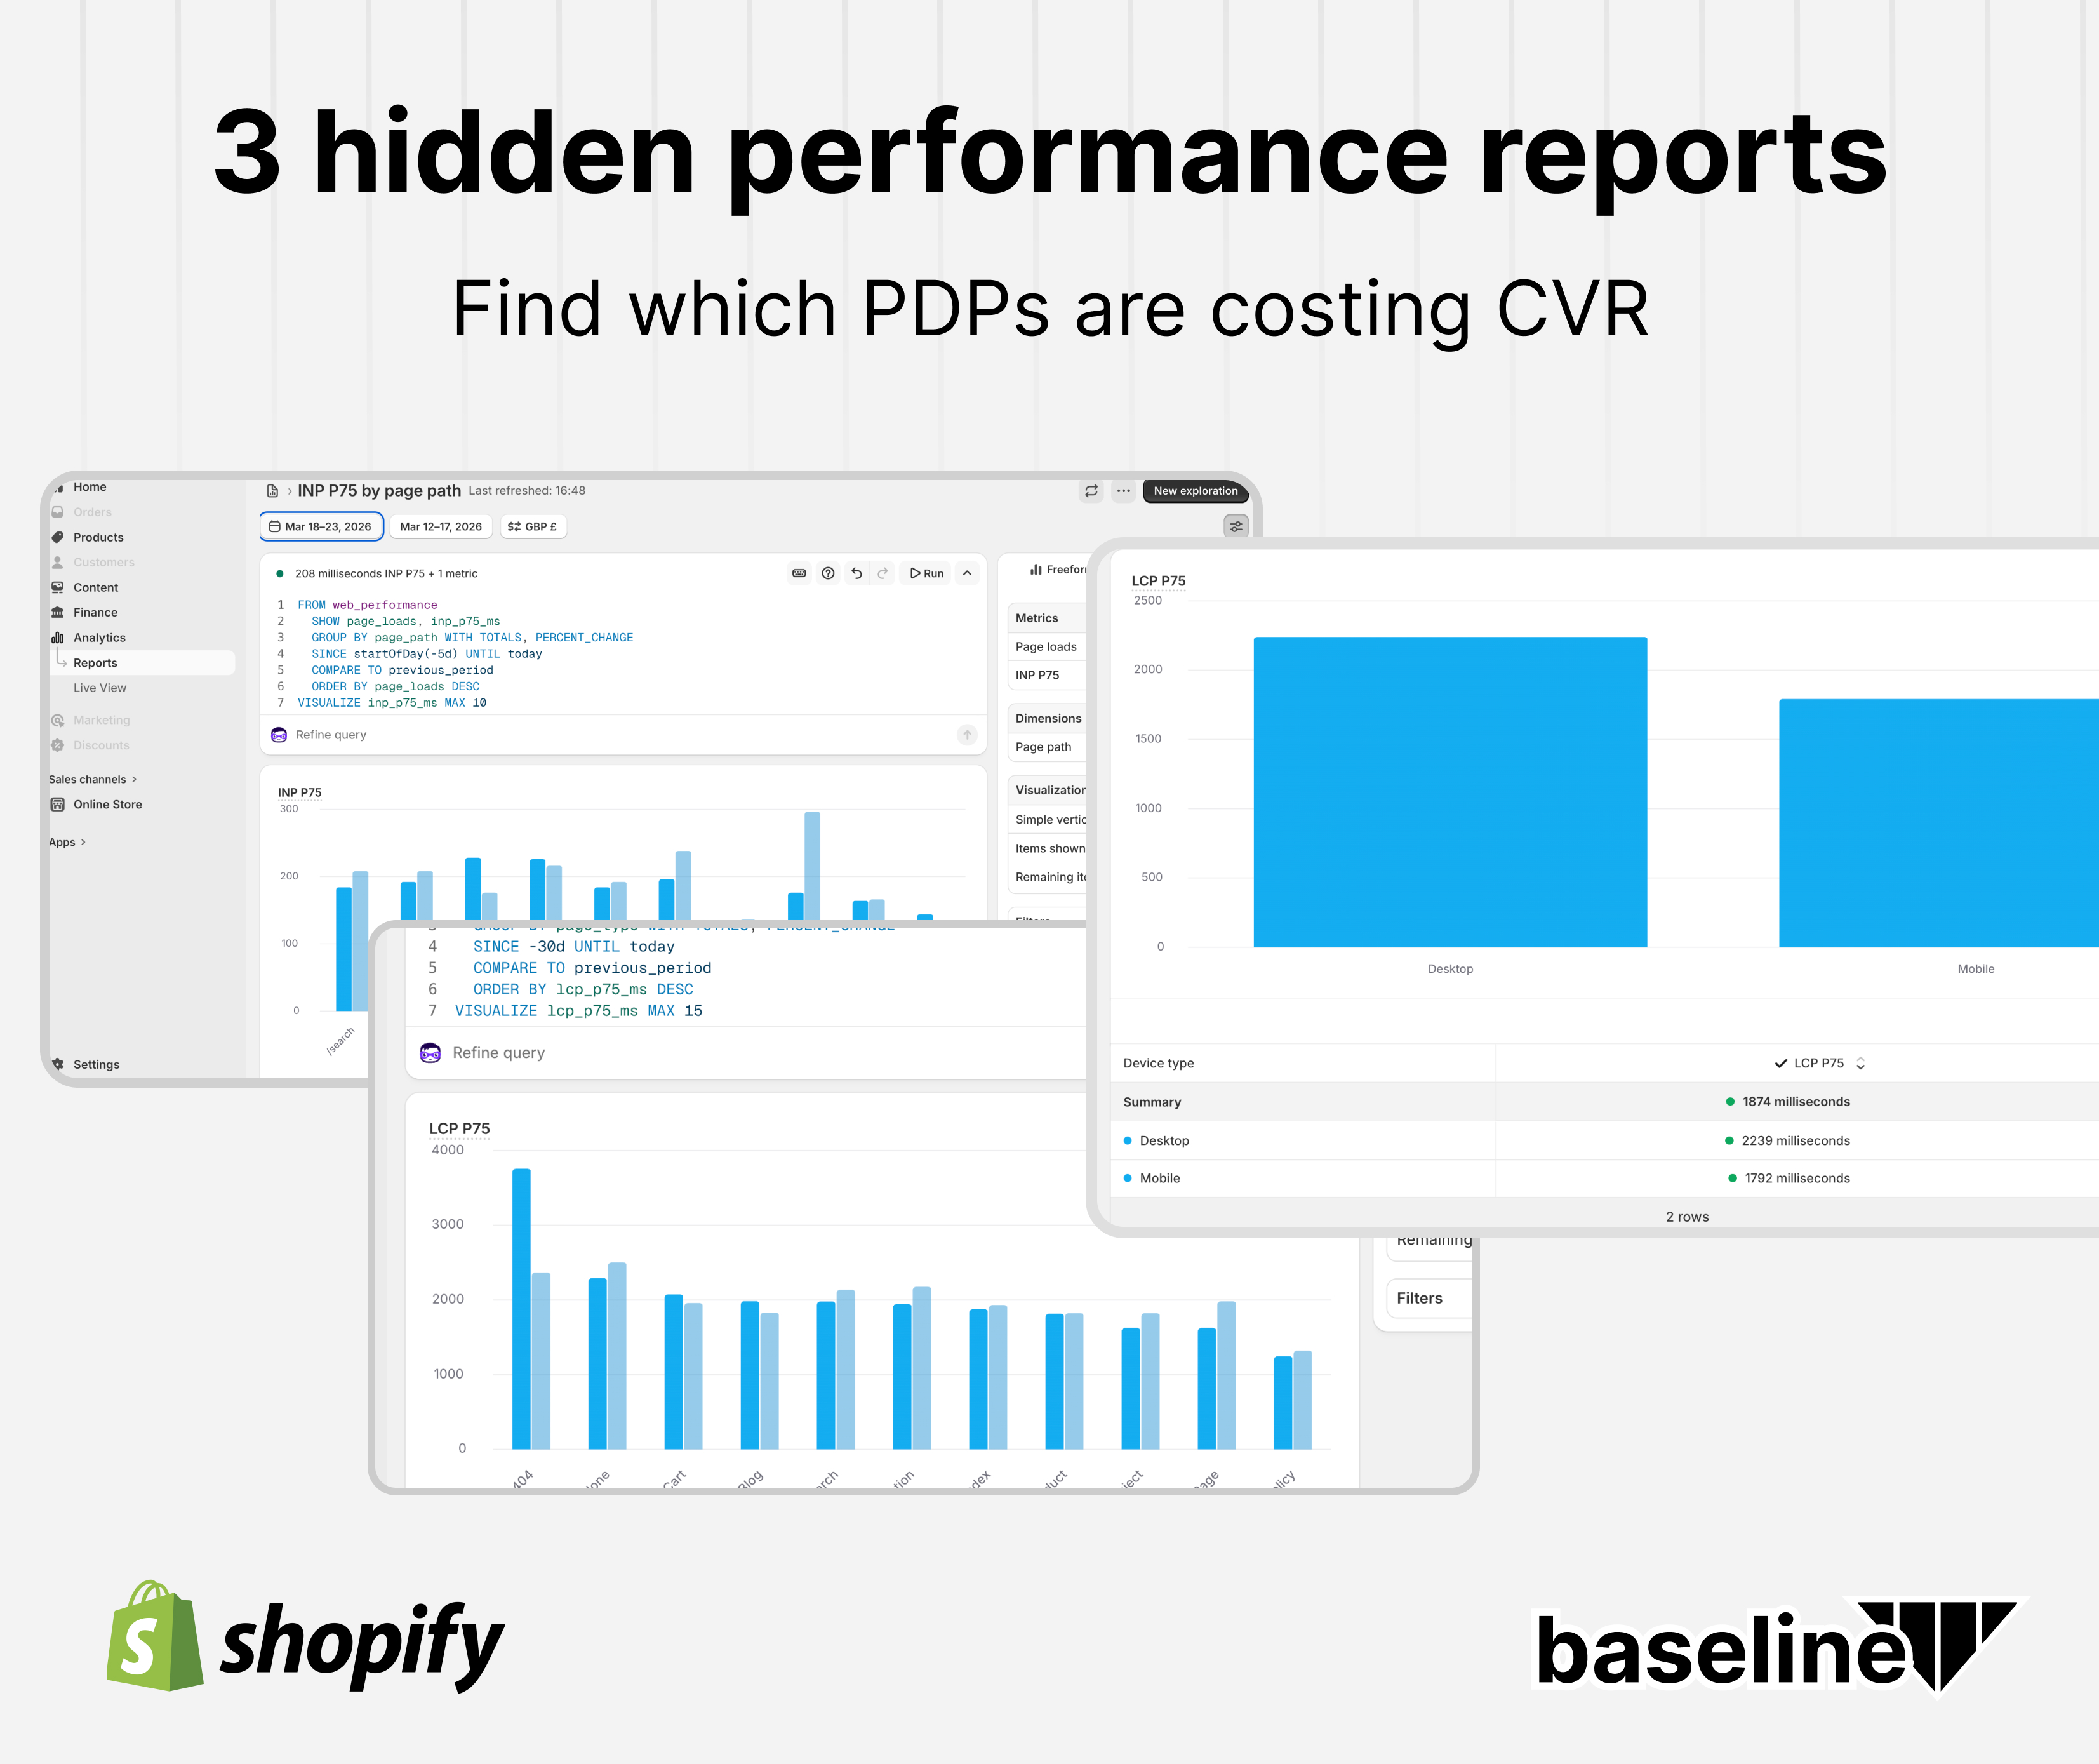
Their Core Web Vitals dashboard showed green across the board. LCP under 2.5 seconds. INP within acceptable range. No red flags. Performance wasn't on the agenda.
Then their dev team ran one extra report: LCP split by device type.
Desktop LCP: 2,239 milliseconds. Mobile LCP: 1,792 milliseconds.
Desktop was 25% slower than mobile. On a site where desktop users convert at 3–4x the rate of mobile users, that gap wasn't a technical footnote. It was a revenue leak hiding in plain sight behind a blended average.
The default Shopify CWV reports are designed to give you a quick summary. But summary data by definition smooths over variation. It tells you how your store performs on average. It doesn't tell you which devices are struggling, which page templates are slow, or which specific URLs are bleeding your best traffic.
This post walks through 3 custom reports you can build inside Shopify Analytics, using their built-in query explorer, to get the actual picture.
Why the Default CWV Summary Misleads You
Shopify's standard CWV view shows you blended averages across your entire store. Every device. Every page type. Every URL. Combined into a single number.
That number is almost always more flattering than reality.
Here's why: your fast pages compensate for your slow ones. Your mobile traffic (which tends to have better LCP on Shopify because mobile images are smaller) drags the average down toward "acceptable." Meanwhile, your desktop users, who visit your collection pages, compare products, and spend more per order, are hitting 2+ second LCP on their first meaningful paint.
The blended average says: you're fine. The device split says: your highest-intent users are waiting the longest.
The same logic applies to page types. A slow 404 page or a sluggish cart template won't show up as a crisis in your overall score, but it absolutely matters when a customer hits that 404 mid-browse, or when your cart takes 2 seconds to load after they've already decided to buy.
How to Access the Report Explorer
These reports use Shopify's built-in analytics query tool. No third-party app, no developer needed.
Navigate to: Shopify Admin → Analytics → Reports
In the top right corner, click New exploration.
This opens Shopify's freeform analytics interface. You'll see:
- A query editor (left panel): this is where you paste the ShopifyQL queries below
- A visualization panel (bottom): the chart output
- A right sidebar: Metrics, Dimensions, Visualization settings, Filters
To run a query: paste it into the query editor, then click Run (or press Cmd + Enter on Mac).
The queries below are copy-paste ready.
Report 1: LCP and INP Split by Device Type

This is the report that surfaced the desktop problem at the 9-figure brand. Run this one first.
What you'll learn: How your LCP and INP differ between Desktop and Mobile users. If there's a meaningful gap, you now know which device type to prioritize in your optimization work.
The Query
FROM web_performance
  SHOW lcp_p75_ms, inp_p75_ms
  GROUP BY device_type WITH TOTALS
  SINCE -30d UNTIL today
  ORDER BY lcp_p75_ms DESC
  VISUALIZE lcp_p75_ms MAX 10
Paste this into the query editor and click Run.
What You're Looking At
The table at the bottom gives you the clearest read:
- Summary row: the blended average across all devices (this is what the default dashboard shows you)
- Desktop row: LCP and INP for desktop users specifically
- Mobile row: LCP and INP for mobile users
Healthy split: Desktop and mobile within ~200ms of each other on LCP. INP under 200ms on both.
Problem signs:
- Desktop LCP significantly higher than mobile (desktop users are your highest-intent buyers)
- INP above 200ms on either device. The yellow/orange indicator in Shopify's UI signals this.
- Summary LCP looks acceptable but one device row is near or over 2,500ms
Adjusting the Date Range
SINCE -30d UNTIL today pulls the last 30 days. You can change this to:
SINCE -7d UNTIL today: last week (good after a site change to see quick impact)SINCE startOfDay(-5d) UNTIL today: last 5 days (tighter window to spot recent regressions)- Add
COMPARE TO previous_periodbeforeORDER BYto show period-over-period change
Report 2: LCP and INP Split by Page Type

Once you know which device has a problem, this report tells you which type of page is causing it. Shopify automatically categorizes every URL into a page type: product, collection, index (homepage), cart, blog, search, etc.
What you'll learn: Which page templates are slowest. A slow product page affects every product URL on your store. A slow collection page affects every /collections/ path. This tells you where to direct your developer's time.
The Query
FROM web_performance
  SHOW lcp_p75_ms, inp_p75_ms
  GROUP BY page_type WITH TOTALS, PERCENT_CHANGE
  SINCE -30d UNTIL today
  COMPARE TO previous_period
  ORDER BY lcp_p75_ms DESC
  VISUALIZE lcp_p75_ms MAX 15
Paste this into the query editor and click Run.
What You're Looking At
The chart ranks your page types from slowest to fastest LCP. The lighter bars are the previous period, so you can immediately see whether things are improving or getting worse.
What the data typically surfaces:
- Cart and checkout pages matter most. A slow cart directly impacts purchase completion. If cart LCP is above 2 seconds, you're potentially losing buyers who've already decided to purchase.
- Collection pages are your second-highest-intent pages and are often where performance issues appear because of the volume of product images loading simultaneously.
- Product pages are your primary conversion surface. LCP here is almost always the hero/first product image. This is where preloading (and
fetchpriority: high) has the most direct impact.
Removing the Period Comparison
If you want a cleaner single-period view (easier to screenshot and share with a team), remove PERCENT_CHANGE and COMPARE TO previous_period:
FROM web_performance
  SHOW lcp_p75_ms, inp_p75_ms
  GROUP BY page_type WITH TOTALS
  SINCE -30d UNTIL today
  ORDER BY lcp_p75_ms DESC
  VISUALIZE lcp_p75_ms MAX 10
Report 3: LCP and INP by Page Path (Ranked by Traffic)

The first two reports tell you which devices and which templates have problems. This one tells you which specific URLs on your store are both high-traffic and slow, the exact intersection where fixing something has the most revenue impact.
What you'll learn: Your top pages by visit volume, with their LCP and INP scores. A page that gets 10,000 visits a month with a 3-second LCP is a much higher priority than a page with 50 visits and a 3-second LCP.
The Query
FROM web_performance
  SHOW page_loads, inp_p75_ms
  GROUP BY page_path WITH TOTALS, PERCENT_CHANGE
  SINCE startOfDay(-5d) UNTIL today
  COMPARE TO previous_period
  ORDER BY page_loads DESC
  VISUALIZE inp_p75_ms MAX 10
Paste this into the query editor and click Run.
What You're Looking At
This report orders your URLs by page_loads (traffic volume) descending. The most visited pages appear first. The chart shows INP P75 at each URL, but you can switch this to lcp_p75_ms in the VISUALIZE line if you want to see LCP instead.
How to use this:
- The top 10 URLs in this report are your most visited pages. These are your highest-leverage optimization targets.
- Check whether the slow pages in Report 2 (by page type) match the high-traffic URLs here
- If your
/collections/allpage is both your most visited and has a 2,500ms LCP, that's your priority fix, not the/pages/aboutpage with 80 visits - Based on your business - you should pick the most fragile pages. If you run ads to a page, you want to a better impression than search. People who find your blogs via SEO are likely more patient as they know what they are getting. Ads tend to be more fickle.
Switching Between LCP and INP
The query above shows inp_p75_ms in the chart. To switch to LCP:
- Change
SHOW page_loads, inp_p75_mstoSHOW page_loads, lcp_p75_ms - Change
VISUALIZE inp_p75_ms MAX 10toVISUALIZE lcp_p75_ms MAX 10
To show both LCP and INP in the data table alongside page_loads:
FROM web_performance
  SHOW page_loads, lcp_p75_ms, inp_p75_ms
  GROUP BY page_path WITH TOTALS, PERCENT_CHANGE
  SINCE -30d UNTIL today
  COMPARE TO previous_period
  ORDER BY page_loads DESC
  VISUALIZE lcp_p75_ms MAX 10
Combining the Reports: The Right Order of Operations
Run these reports in sequence:
Step 1: Device split. Identify whether Desktop or Mobile is the bigger problem. This tells you which environment to prioritize when testing fixes.
Step 2: Page type split. Identify which template type is causing the most damage. If desktop is slow and product pages have the worst LCP, the fix is in your product template's image loading, almost always the hero/first product image.
Step 3: Page path by traffic. Confirm the specific URLs that matter most. Use these as your before/after benchmark when implementing fixes.
Bonus: Add a device filter to Reports 2 and 3. You can add a WHERE clause to any of these queries to filter by device. For example, to see page type performance for desktop only:
FROM web_performance
  SHOW lcp_p75_ms, inp_p75_ms
  GROUP BY page_type WITH TOTALS
  WHERE device_type = 'desktop'
  SINCE -30d UNTIL today
  ORDER BY lcp_p75_ms DESC
  VISUALIZE lcp_p75_ms MAX 10
This is where the real diagnostic power is. You can see exactly which page types are slow specifically on desktop, then cross-reference with your highest-traffic URLs on desktop to build a prioritized fix list.
What to Do With What You Find
These reports diagnose the problem. They don't fix it. But knowing where to look cuts investigation time dramatically.
If a specific page type (e.g., collection) has high LCP: Every collection page on your store has the same root cause, usually the first product grid image loading lazily when it should load eagerly.
If cart LCP is high: Cart pages load a lot of app JavaScript (upsell widgets, reviews, countdown timers). Defer what you don't need above the fold.
If 404 LCP is catastrophically high and you have significant 404 traffic: Fix your broken links and set up proper redirects. You're paying a performance tax on URLs that serve no customers.
Get the Full Shopify Audit
If you find some interesting results and want an expert pair of eyes on the store, grab a personalised audit below. We will look at your store and find the biggest opportunities to fix our problem pages.